


Ethereum price started a recovery wave above the $2,280 zone. ETH is now consolidating and might struggle to continue higher above the $2,320 resistance.
- Ethereum started a recovery wave from the $2,235 zone.
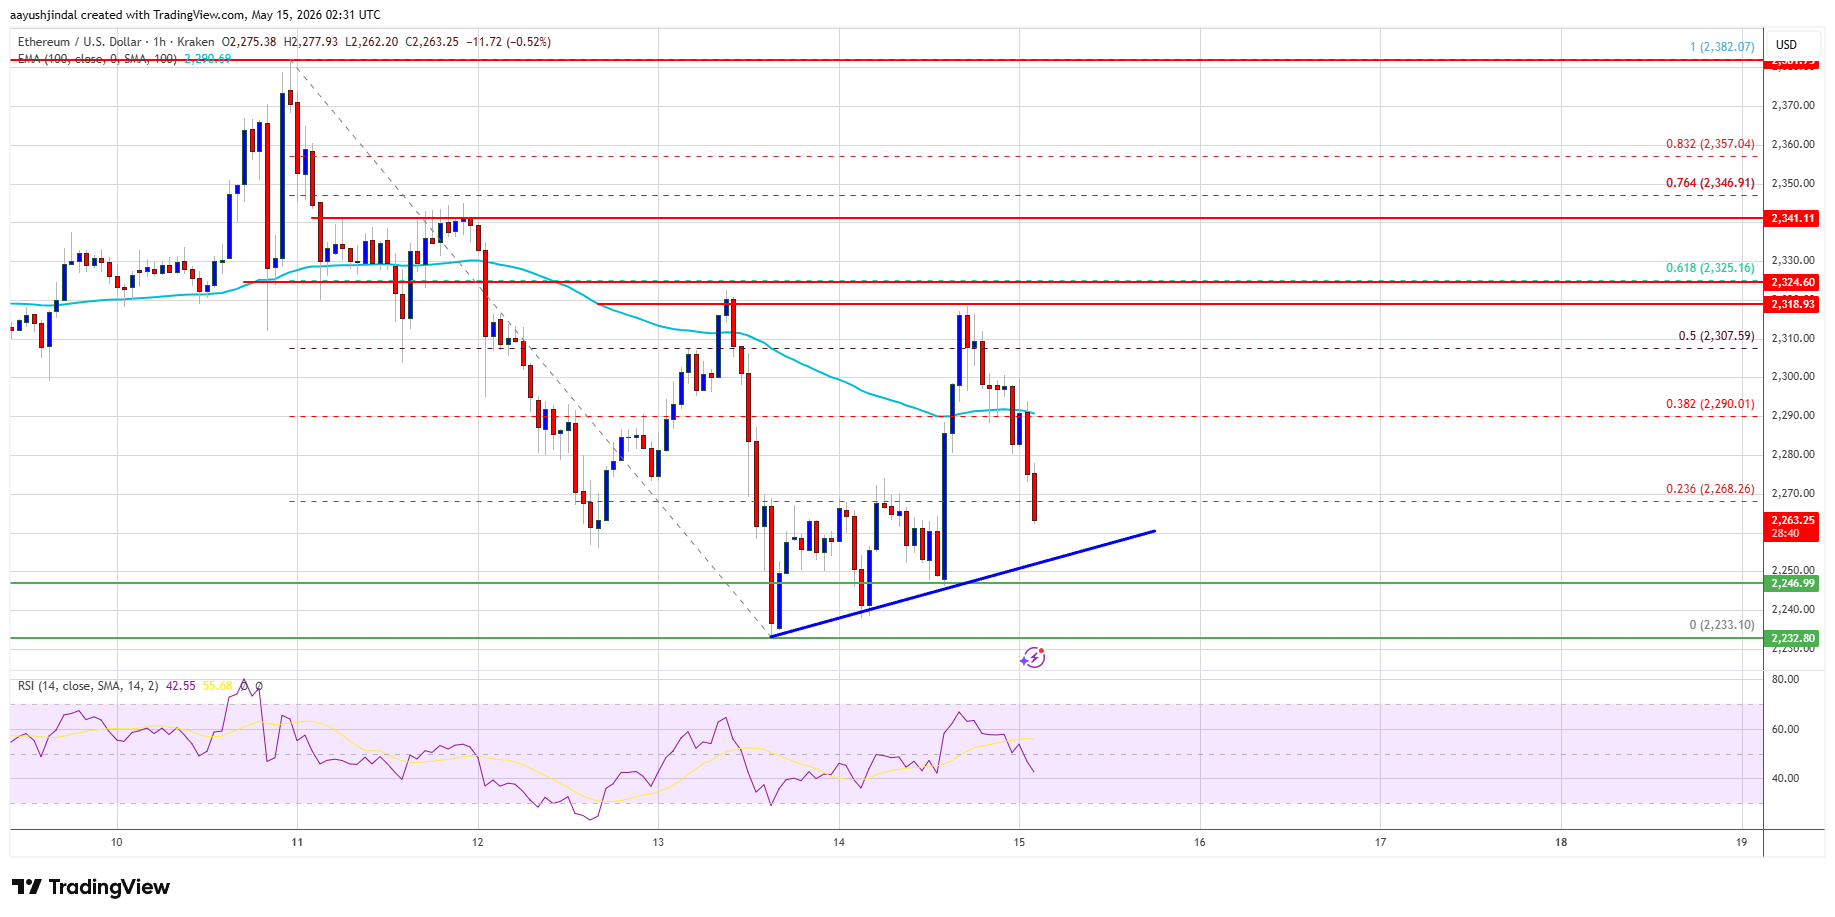
- The price is trading below $2,300 and the 100-hourly Simple Moving Average.
- There is a bullish trend line forming with support at $2,260 on the hourly chart of ETH/USD (data feed via Kraken).
- The pair could start a fresh decline if it stays below the $2,320 zone.
Ethereum Price Faces Hurdles
Ethereum price remained bid above the $2,220 support zone and attempted to recover, like Bitcoin. ETH price formed a base and started a recovery wave above the $2,265 resistance.
The price surpassed the 50% Fib retracement level of the downward move from the $2,382 swing high to the $2,233 low. The bulls even pushed the price toward $2,320. The bears remained active and pushed the price below $2,300.
Ethereum price is now trading below $2,300 and the 100-hourly Simple Moving Average. Besides, there is a bullish trend line forming with support at $2,260 on the hourly chart of ETH/USD.
If the bulls remain in action above $2,260, the price could attempt another increase. Immediate resistance is seen near the $2,300 level. The first key resistance is near the $2,320 level or the 61.8% Fib retracement level of the downward move from the $2,382 swing high to the $2,233 low.
The next major resistance is near the $2,380 level. A clear move above the $2,380 resistance might send the price toward the $2,420 resistance. An upside break above the $2,420 region might call for more gains in the coming days. In the stated case, Ether could rise toward the $2,500 resistance zone or even $2,550 in the near term.
More Losses In ETH?
If Ethereum fails to clear the $2,320 resistance, it could start a fresh decline. Initial support on the downside is near the $2,260 level. The first major support sits near the $2,250 zone.
A clear move below the $2,250 support might push the price toward the $2,220 support. Any more losses might send the price toward the $2,150 region. The main support could be $2,120.
Technical Indicators
Hourly MACD – The MACD for ETH/USD is gaining momentum in the bearish zone.
Hourly RSI – The RSI for ETH/USD is now below the 50 zone.
Major Support Level – $2,250
Major Resistance Level – $2,320


