


Bitcoin’s extended pullback from its all-time high has left traders in uncertainty, and many investors are unsure whether the worst of the decline has already passed.
One analyst known as Jelle on X is of the notion that the conversation may be missing an uncomfortable reality that Bitcoin bear markets often become far more painful than most participants expect. The price data, he argues, supports a more concerning interpretation of how Bitcoin’s current pullback will play out.
Current Bitcoin Decline Still Smaller Than Previous Bear Markets
Crypto analyst Jelle issued an interesting warning to investors who may be underestimating the depth and duration of Bitcoin bear markets. In a post on X, Jelle noted that Bitcoin is currently down roughly 44% from its all-time high of $126,080, with the February local bottom around $63,000 registering a 53% decline from the peak. These sound severe on the surface. However, they are relatively modest against the historical record.
Historical data shows that Bitcoin’s previous bear markets pushed the asset much deeper below its peak. The market collapse following the 2017 rally eventually erased about 84% of Bitcoin’s value, while the bear market that followed the 2021 cycle bottomed near a 77% decline.
A review of the chart Jelle shared, which is shown below, illustrates just how consistent the cyclical structure has been. Since 2014, Bitcoin has oscillated through periods of sustained accumulation and declines. Each bull run lasts approximately 150 to 152 weeks, and each bear market persists for anywhere between 52 and 58 weeks.
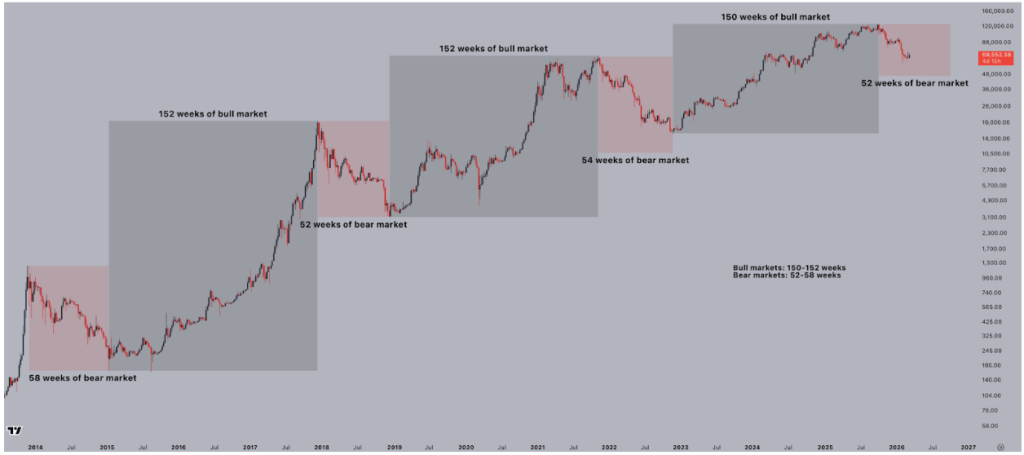
Bitcoin Price Chart. Source: @CryptoJelleNL On X
The current bear phase, by that measure, is well short of the duration at which prior cycles found their floors. Projecting the bear market phase from the October 2025 all-time high would put the current correction lasting until sometime around October 2026.
“Unfortunately, I think there is more pain ahead for BTC,” Jelle said.
The RSI Is Telling Investors To Wait
The analyst also examined Bitcoin’s relative strength index indicator, which has repeatedly provided clues about when bear markets are nearing completion, in another post. Jelle observed that every previous bear market eventually bottomed when the weekly RSI dropped below the 37 level. Once the indicator crosses below that threshold, it often falls further before the Bitcoin price reaches its final low.
Bitcoin has declined roughly 30% since the RSI first moved below that level in the current cycle. That decline is smaller than what occurred in earlier cycles, though not enough to stand out as a clear anomaly given the limited number of examples.
More important, according to Jelle, is the pattern that forms near the end of a bear market. The final low usually appears when the RSI creates a higher low close to the level recorded during the previous bottom. That higher low can occur alongside either a lower price low or a higher price low.
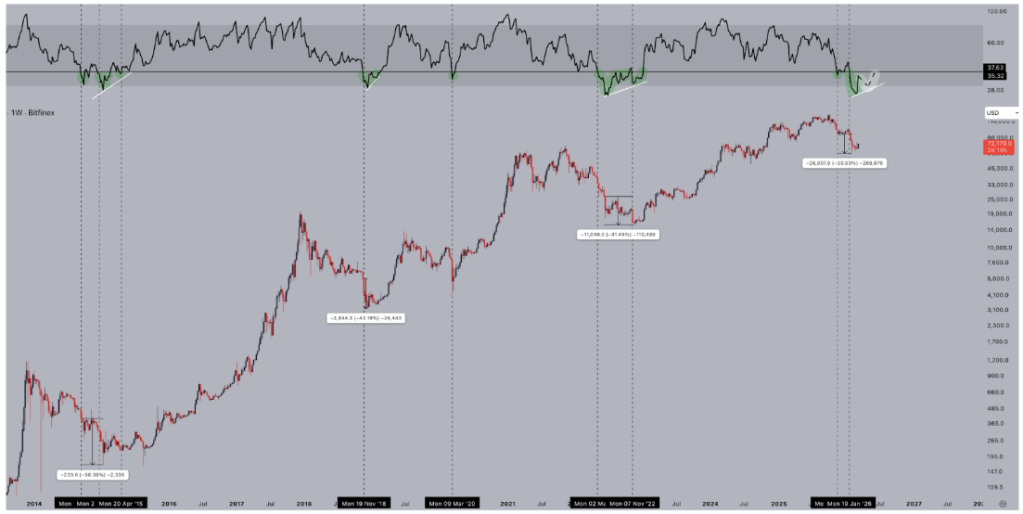
Bitcoin Price Chart. Source: @CryptoJelleNL On X
When price forms a lower low but RSI prints a higher low, the price action produces a bullish divergence on the weekly chart. That signal has always preceded the transition from bear market conditions into the next accumulation phase. Until that structure becomes visible, patience is the best approach.
Featured image from Unsplash, chart from TradingView


