


After retreating from late-2025 highs, Bitcoin has spent much of recent trading days fluctuating between the mid-$80,000s and low-$90,000s, with buyers consistently stepping in on dips and sellers defending the same resistance level.
Interestingly, this technical setup resembles the structure Bitcoin formed before its last major rally that eventually pushed it to its price peak above $126,000.
Bitcoin Revisits A Familiar Consolidation Structure
A closer look at BTC price action on the daily candlestick timeframe chart shows that the leading cryptocurrency is tracing a pattern that looks very similar to what played out between March and May 2025.
In that earlier phase, Bitcoin spent weeks trading between roughly $76,000 and $86,000, repeatedly failing to break higher and giving the impression of stagnation. During that time, the Bitcoin price held above support levels and continued to print lower lows within the range and gave the impression of a lack of immediate upside.
That consolidation ultimately proved to be a base. Once Bitcoin broke above the upper boundary of that range at $86,000, the sentiment changed very quickly and created the stage for a strong upside move that eventually led to Bitcoin.
The current structure shows the same characteristics, only at a higher altitude. This time, Bitcoin is ranging between approximately $84,000 and $94,000, with price compressing in a similar way to early 2025.
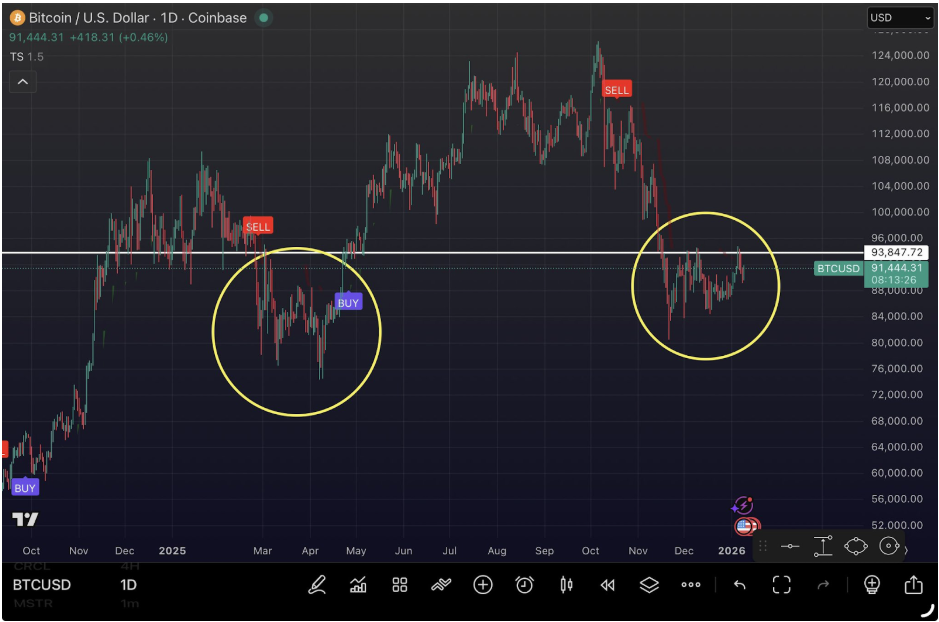
Bitcoin Price Chart. Source: @aganstwallst On X
Why Bitcoin Might Push To New ATHs
The $94,000 level has become the primary area determining Bitcoin’s current upward price action. Bitcoin’s price action tested this zone during an early January rally, briefly pushing toward $94,500 on January 5 before facing rejection and dropping back into correction. That rejection is now in the past, and the next priority is what Bitcoin might do once it finally secures a decisive break above this resistance.
The previous performance is a good reference point for what could follow a confirmed breakout. After Bitcoin cleared $86,000 during the prior consolidation last year, it pushed up for many months, eventually reaching a peak price of around $126,080. That move represented a gain of about 46% from the breakout level.
No two price movements can play out in exactly the same way, but the similarities between the current setup and last year’s structure suggest that Bitcoin may once again be building energy below resistance.
If Bitcoin delivers a comparable expansion after breaking above $94,000, the projected upside targets would extend a little above $126,000 and lead to the creation of a new all-time high. Applying the same percentage move from $94,000 points to a potential advance to as high as $138,000.
Featured image from Pexels, chart from TradingView


